AI: The Fourth Industrial Revolution is Here

This is a once-in-a-generation investment cycle. The AI revolution is unfolding, and Dan Ives’ research is the playbook. For investors, professionals, and technologists alike, Wedbush’s AI Revolution report is a roadmap to the companies shaping this
transformation.

Wedbush Enters the ETF Market

Los Angeles, CA – February 18, 2025 – Wedbush, a Los Angeles-based financial services firm with global reach, and a legacy of innovation and client-focused investment solutions, introduces Wedbush Fund Advisers and announces its entry into the rapidly growing exchange-traded fund (ETF) market.

What is an ETF-and Why They’ve Become Core Portfolio Building Blocks

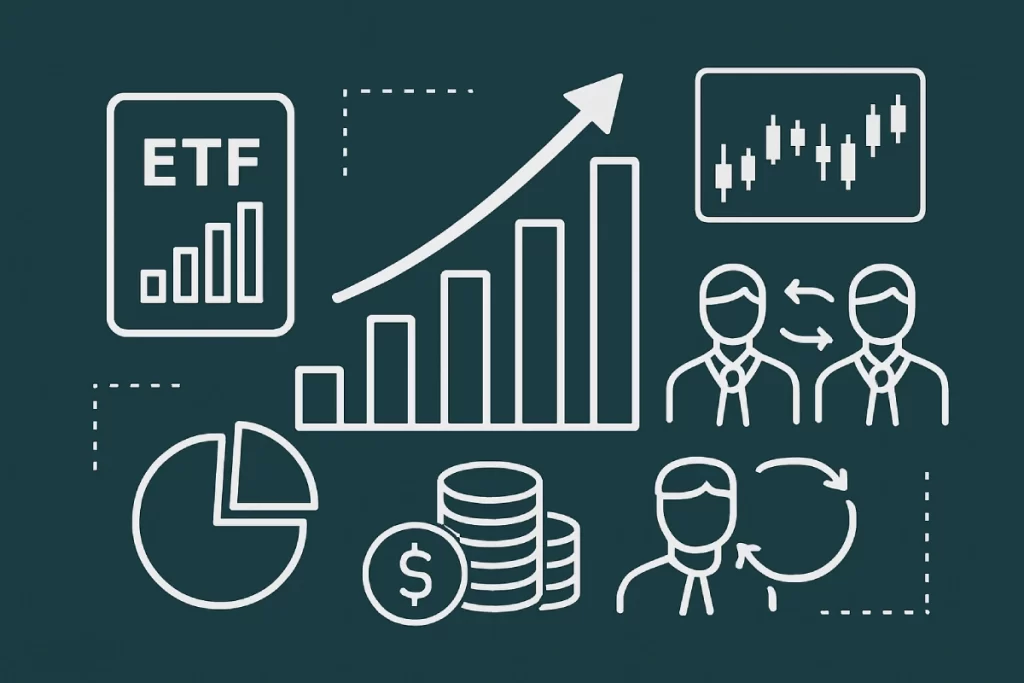
In the evolving landscape of investment products, few innovations have reshaped portfolio construction as meaningfully as the Exchange-Traded-Fund (ETF). Once considered a passive alternative to mutual funds, ETFs have become foundational instruments for institutions and individual investors alike—offering broad access, liquidity, and cost efficiency.

Thematic ETFs Today

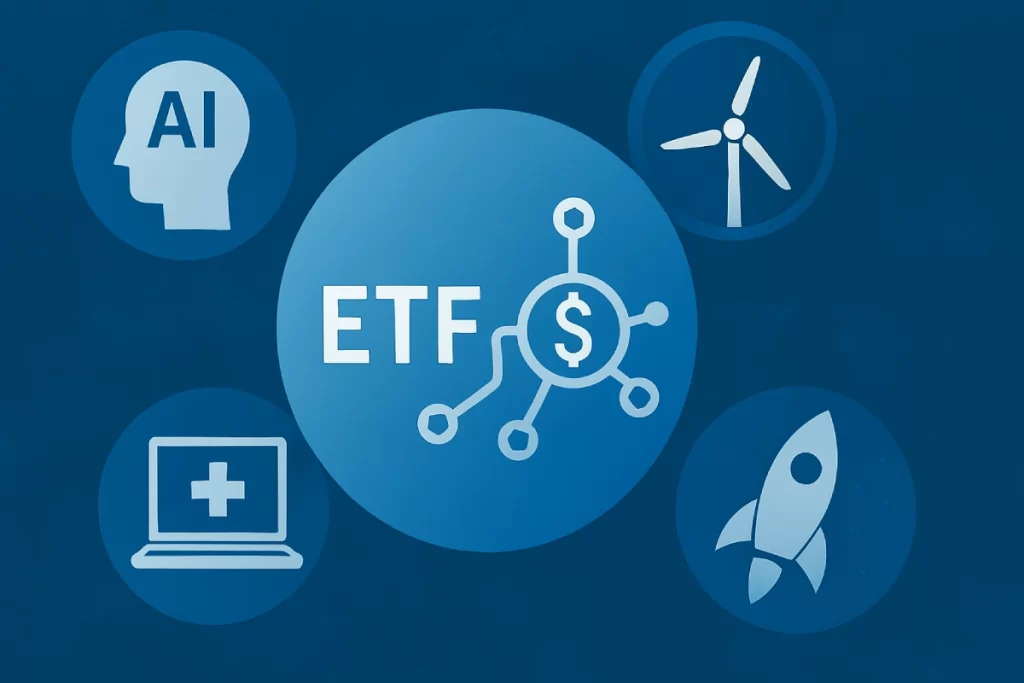
In an investment landscape shaped by rapid technological change and evolving consumer behavior, many investors are seeking to position their portfolios to benefit from the trends shaping the future.

How to Evaluate an ETF Before You Invest

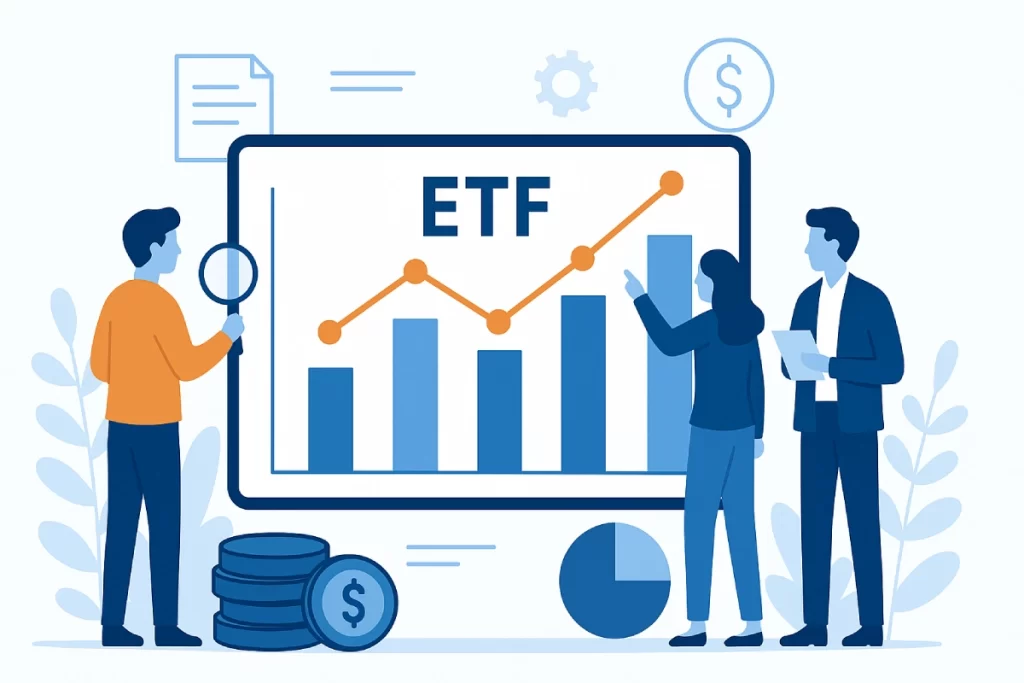
In a market saturated with thousands of exchange-traded-funds (ETFs)—each offering varying exposures, structures, and costs—thoughtful due diligence is essential. For allocators, advisors, and direct investors alike, evaluating an ETF is about far more than past performance. It’s about understanding the mechanics, risks, and alignment with portfolio objectives.

Latest Discount As of 7/11/2025

NAV $26.88
Market Price $26.89
Premium (Discount) $0.01
Premium Discount % 0.03%

Current View 2025 Q2 As of 7/1/2025

Days at Premium 17
Days at NAV 1
Days at Discount 1
Greatest Premium 1.04%
Greatest Discount -0.04%

Latest Discount As of 7/11/2025

Hover over the chart points for details
i View chart Explanation The Premium/Discount chart demonstrates the difference between the daily market price of shares of the Fund and the Fund’s net asset value (NAV). The vertical axis of the chart shows the premium or discount of the daily market price as a percentage of the NAV. The horizontal axis shows each trading day in the time period, and each data point in the chart represents the Premium/Discount on that day. The data presented in the chart and table above represent past performance and cannot be used to predict future results.

What does it mean when the Fund trades at a premium/discount to its NAV?
The primary explanation is that discrepancies can arise as a result of the timing of the calculation of Fund net asset value (NAV) and the trading price of the Fund on the open market. Open market prices are affected by the constant flow of information received by investors, corporations and financial institutions. Depending on how this changing information affects investor sentiment, shares of the Fund may deviate slightly from the value of the Fund’s underlying assets. The NAV of the Fund is only calculated once a day (normally at 4:00 p.m. eastern time). As a result, shareholders may pay more than NAV when they buy Fund shares and receive less than NAV when they sell those shares, because shares are purchased and sold at current market prices. However, due to the creation and redemption process that is unique to ETFs, market makers are able to minimize these deviations from NAV by taking advantage of arbitrage opportunities.

What causes these time differences?
Close of Trading Times. Although both the NAV and the daily market price of the Fund are generally calculated based on prices at the closing time of the exchange (generally 4:00 p.m. eastern time), slight differences in this timing may cause discrepancies.
Time of Last Trade. Trading of the Wedbush Funds generally takes place during normal trading hours (9:30 a.m. to 4:00 p.m. eastern time). However, it is important to note that the last trade – from which the closing price is determined – may not occur at exactly 4:00 p.m. eastern time. Therefore, changing market sentiment during the time difference may cause the NAV to differ from the closing price.
International Holdings. The premiums and discounts for funds with significant holdings in international markets may be less accurate due to the different closing times of various international markets. Because the Funds trade during U.S. market hours while the underlying securities may not, the time lapse between the markets can result in differences between the NAV and the trading price.

Latest Discount As of 7/11/2025

NAV $26.88
Market Price $26.89
Premium (Discount) $0.01
Premium Discount % 0.03%

Current View 2025 Q2 As of 7/11/2025

Days at Premium 17
Days at NAV 1
Days at Discount 1
Greatest Premium 1.04%
Greatest Discount -0.04%

Latest Discount As of 7/11/2025

Hover over the chart points for details
i View chart Explanation The Premium/Discount chart demonstrates the difference between the daily market price of shares of the Fund and the Fund’s net asset value (NAV). The vertical axis of the chart shows the premium or discount of the daily market price as a percentage of the NAV. The horizontal axis shows each trading day in the time period, and each data point in the chart represents the Premium/Discount on that day. The data presented in the chart and table above represent past performance and cannot be used to predict future results.

What does it mean when the Fund trades at a premium/discount to its NAV?
The primary explanation is that discrepancies can arise as a result of the timing of the calculation of Fund net asset value (NAV) and the trading price of the Fund on the open market. Open market prices are affected by the constant flow of information received by investors, corporations and financial institutions. Depending on how this changing information affects investor sentiment, shares of the Fund may deviate slightly from the value of the Fund’s underlying assets. The NAV of the Fund is only calculated once a day (normally at 4:00 p.m. eastern time). As a result, shareholders may pay more than NAV when they buy Fund shares and receive less than NAV when they sell those shares, because shares are purchased and sold at current market prices. However, due to the creation and redemption process that is unique to ETFs, market makers are able to minimize these deviations from NAV by taking advantage of arbitrage opportunities.

What causes these time differences?
Close of Trading Times. Although both the NAV and the daily market price of the Fund are generally calculated based on prices at the closing time of the exchange (generally 4:00 p.m. eastern time), slight differences in this timing may cause discrepancies.
Time of Last Trade. Trading of the Wedbush Funds generally takes place during normal trading hours (9:30 a.m. to 4:00 p.m. eastern time). However, it is important to note that the last trade – from which the closing price is determined – may not occur at exactly 4:00 p.m. eastern time. Therefore, changing market sentiment during the time difference may cause the NAV to differ from the closing price.
International Holdings. The premiums and discounts for funds with significant holdings in international markets may be less accurate due to the different closing times of various international markets. Because the Funds trade during U.S. market hours while the underlying securities may not, the time lapse between the markets can result in differences between the NAV and the trading price.

Distribution History
Ex-Date Record Date Payable Date Amount
2025
01/11/2025 01/11/2025 01/11/2025 $0.257400
03/25/2025 03/25/2025 03/25/2025 $0.357400

Subscribe for Wedbush Funds News and Updates